class: middle, right, title-slide # The use of mixed models in lifespan research ## - key concepts - ### Athanasia Mowinckel ### Feb. 29th 2020 --- # Mixed models in Lifespan research ## Talk outlines .pull-left[ **Background talk** - Lifespan research using cohorts - Lifespan research with longitudinal data - Using linear mixed models with longitudinal data - Using generalized additive mixed models with longitudinal data - Examples of mixed models applied in lifespan studies ] ??? This first talk, I'll go through a little background on mixed models and how they can improve inference from repeated measures data, particularly longitudinal data. Both in terms of linear models, and also in terms of using smoothing splines for non-linear relationships -- .pull-right[ **Practical talk** - Mixed model packages in R - Mixed model formula in R - Running linear mixed models - Running smoothing splines in mixed models ] ??? In the second talk we will go into the practicalities. Covering more exactly how to specify, inspect and evaluate mixed models in R. --- # Doing science .pull-left[ **The recipe** - Figure out a hypothesis - Find a sample to test hypothesis - Run experiment - Run analyses - You have answers ] ??? When I was doing my BA, and also my Master's to some extent, I was presented with stories of doing research being quite straight forward. You follow these seemingly simple steps, and you get to do awesome research and find cool things. -- .pull-right[ **The obstacles** <!-- --> ] ??? Has anyone here played the puzzle game "Portal"? It's a really challenging game of puzzles you need to solve, you are set in a type of experiment and you are told at the end of almost every level or puzzle that you just need to finish all the puzzles and then there will be cake. So you start off with low levels, thinking this isn't too hard, you'll soon get cake. Like science during Uni start, just follow the steps, you will make science. So you start doing your research, and slowly you start realizing there are many hurdles. It's a little trickier that the books claim, there are issues people did not discuss with you. But you keep going, there will be cake. --- class: dark, center # What they don't tell you <img src="https://images-na.ssl-images-amazon.com/images/I/416YS3Qbz2L._SX425_.jpg" width="60%" style="display: block; margin: auto;" /> ??? Well, it's not a complete lie. But the world is much more complex than the text books seem to tell us. And research on humans is very tricky, you cannot control them like you do cell cultures or mice. Humans live their lives, and you are lucky if they participate in your study. So you take anyone wanting to join, and have to make some constrains to your design. --- # Human lifespan research -- .pull-left[ ## What do we want to know? - How are we different at different ages? - How do we develop? - How do we age? - Who will develop diseases like dementia? ] -- .pull-left[ ## How do we study that? - Sampling a wide age range - Population-based studies - Registry studies - Longitudinal studies ] ??? What are the key concepts we want out of Lifespan research, what are the general questions people want answered? But, a search on Pubmed for _human lifespan_ gave me 45993 results, but they mostly seem to discuss the expansion of human life, not the study of human lifespan differences per se. Searching for _Lifespan trajectory_ gave me only 856 results, many of which are animal studies. --- # Lifespan studies on humans - [LCBC studies](https://www.oslobrains.no/) - [Betula - Aging, memory, and dementia](https://www.umu.se/en/research/projects/betula---aging-memory-and-dementia/) - [HCP lifespan](https://www.humanconnectome.org/lifespan-studies) - [Dallas Lifespan Brain Study](http://lodismith.canisiuspsychology.net/studies/dlbs/) - [Southwest University Adult Lifespan Dataset](http://fcon_1000.projects.nitrc.org/indi/retro/sald.html) - [The Rhineland study](https://www.neurodegenerationresearch.eu/it/cohort/the-rhineland-study/) ??? So lifespan studies on human, at least using those words, are not too common, but are becoming increasingly so. It difficult with lifespan samples, because the tests we use to study young children, and older adults are very different, and mapping the same constructs at different ages is quite challenging. To my knowledge, only three of these studies again are longitudinal or prospective. --- class: center # All data synthesized using the LCBC data-base <img src="https://www.oslobrains.no/wp-content/uploads/2017/09/LCBC_wide_compact_full.png" width="72%" style="display: block; margin: auto;" /><img src="https://www.sv.uio.no/psi/personer/vit/oyss/oystein-sorensen-foto-uio.jpg" width="12%" style="display: block; margin: auto;" /> ??? All the data I will be using throughout this talk is synthesized based on the LCBC data-base. Which is a data base with more than 2.500 participants, and over 4500 observations across those participants, many having between 3 and 4 measurement time points. --- class: dark, center # Lifespan research ## - using cohorts - ??? I'll begin walking through doing lifespan research using age cohorts. Something that is very often done, because that is the most convenient way of studying it. However, cohort studies have some _real_ limitations we need to think about, and they constrain the questions we are able to answer. --- # Lifespan research - using cohorts 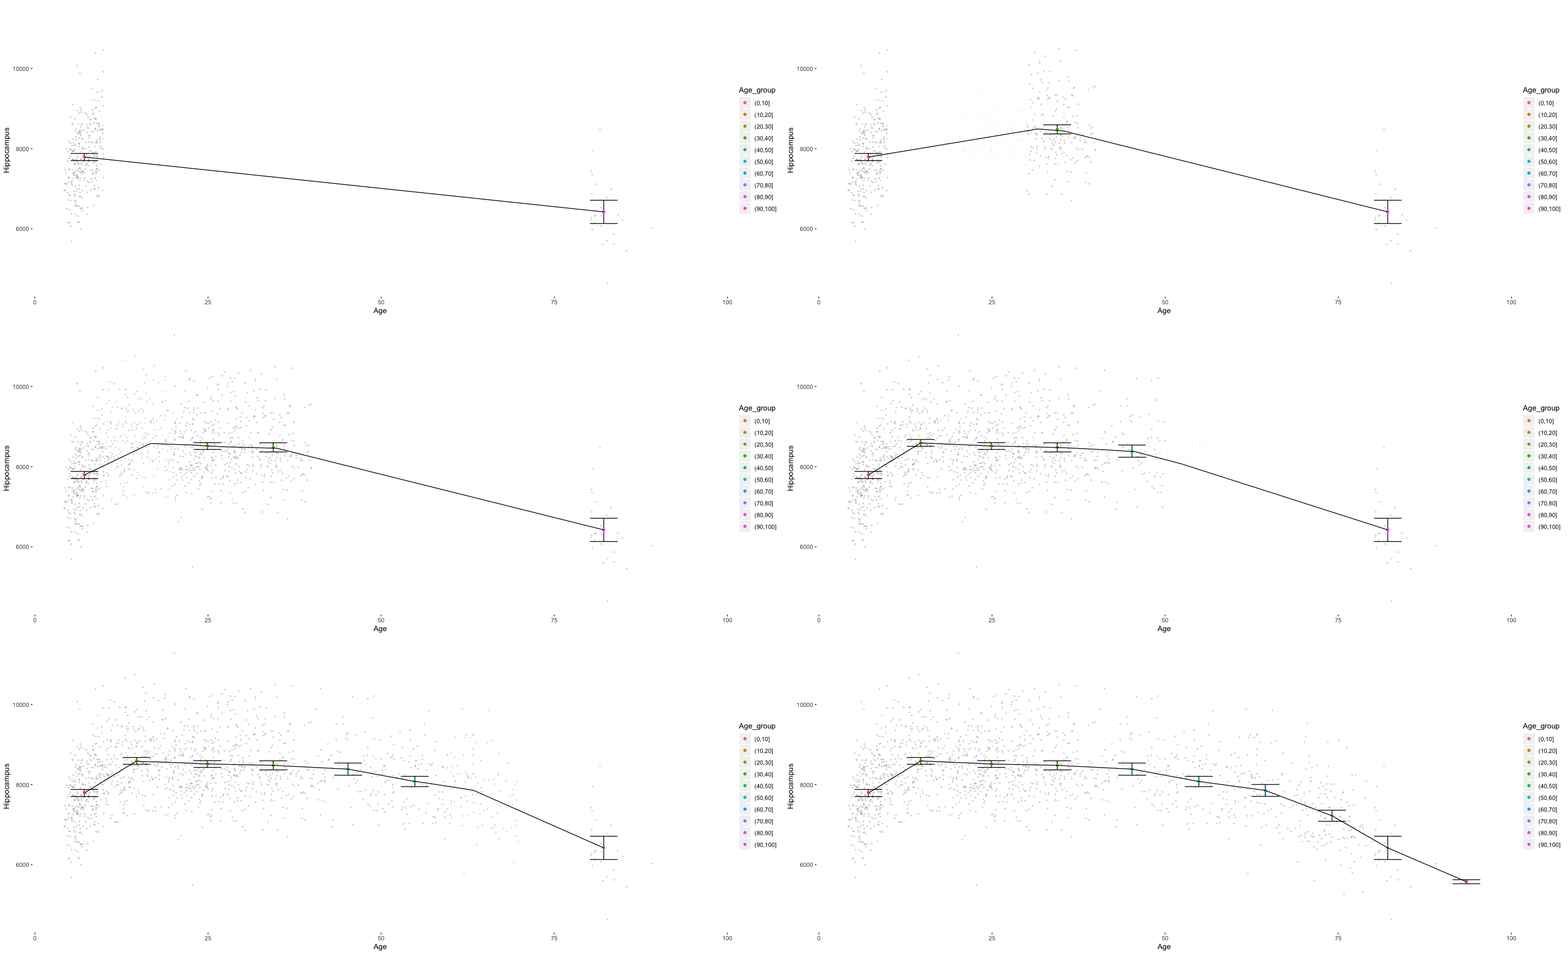<!-- --> ??? If you begin with two samples, you get a nice straight line. The connection looks simple. Then, if you start adding more and more data, filling in the gaps in age, you will start to see that the nice straight line is not so nice and straight, and the variance between different age cohorts also varies. This is not the simple relationship you thought of. --- # Lifespan research - using cohorts 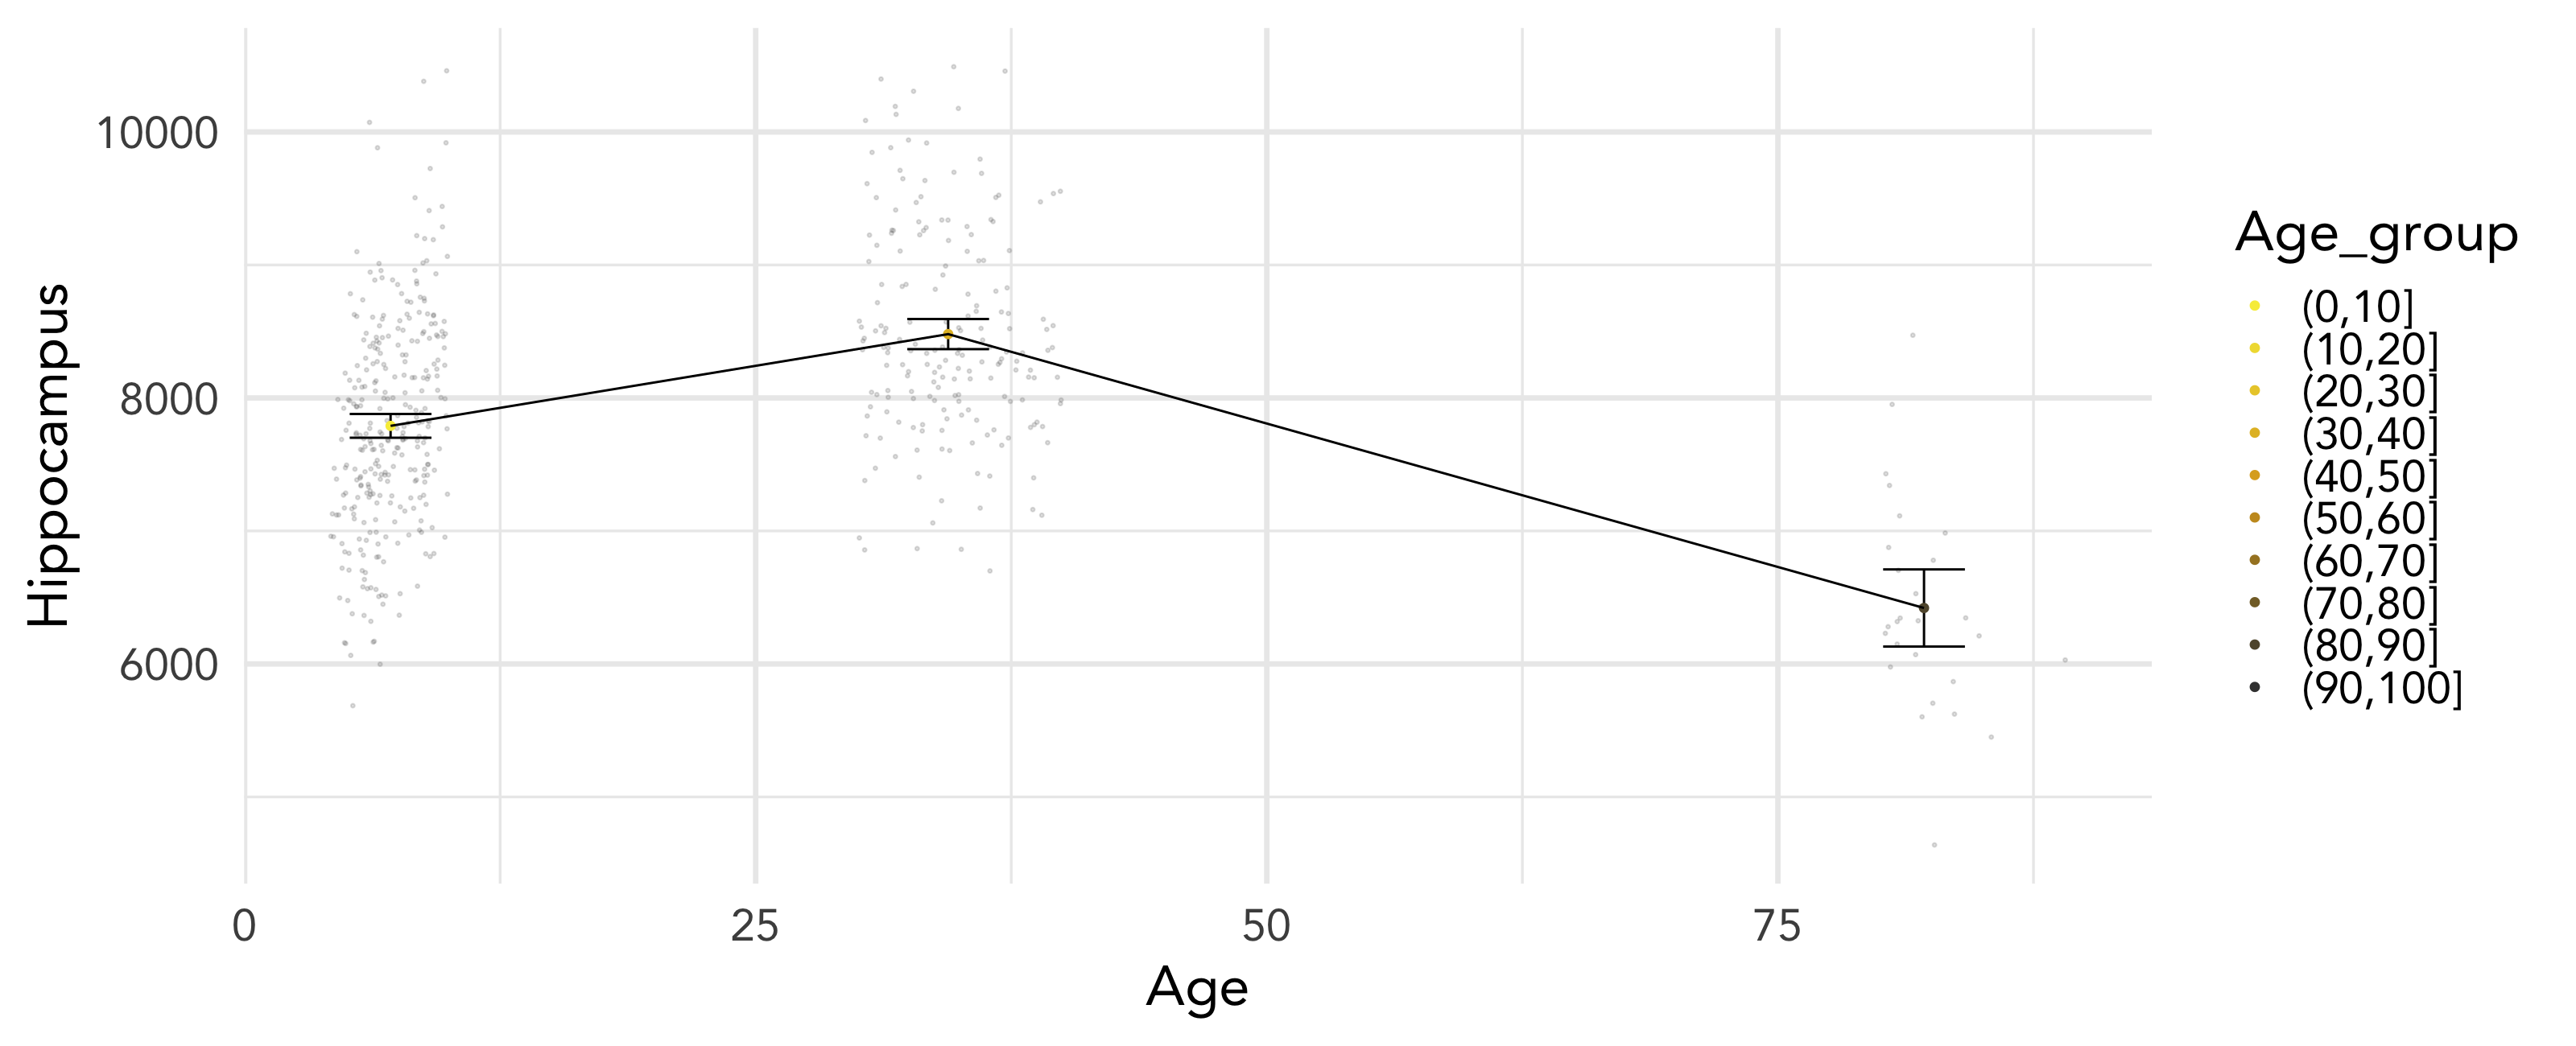<!-- --> ??? Furthermore, what is the difference between these two cohorts? Is it just their age? Can we say that the difference between these two groups is due to age-related changes, or is it tangled together with the generational effects. They are born in completely different times, health care, education, and societal differences are all intertwined in there. --- # Lifespan research - using cohorts 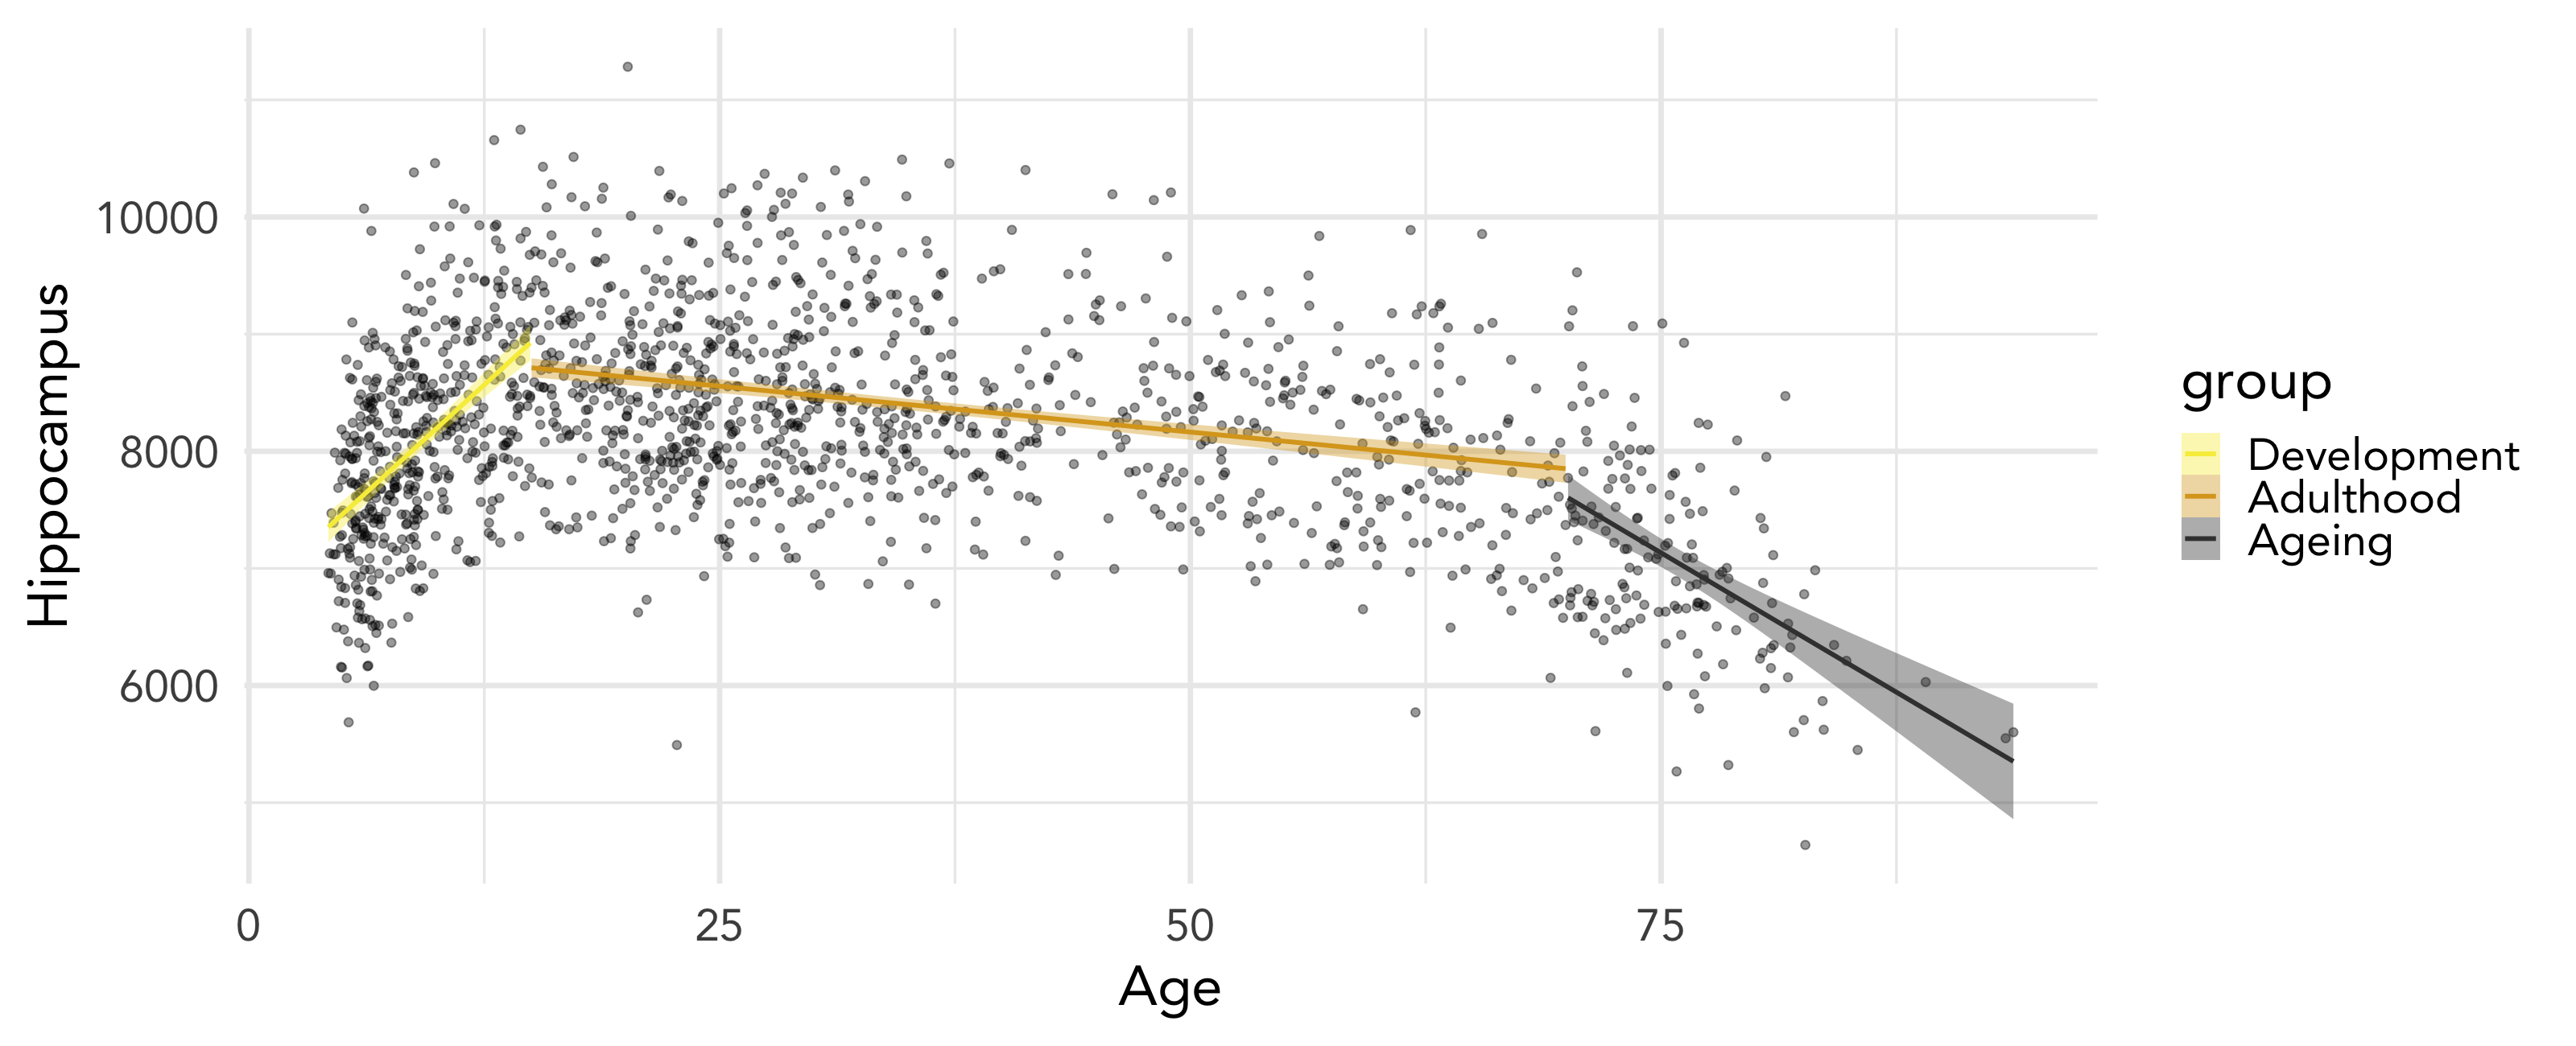<!-- --> ??? In many cases, when people have large samples like this, they'll split them up by age-groups, perhaps using breakpoints in the data. Here I did a rough grouping based on visual inspection only. And there is nothing wrong per se in splitting data up like this, I do this myself when interpretations of my models start being difficult due to directions in young and old age being opposite. --- class: dark # Lifespan research - using cohorts .pull-left[ ## Number of cohorts ### Two or three age cohorts are not enough to elucidate lifespan trajectories ### Given enough cohorts, we can cover the lifespan and reveal plausible trajectories ] -- .pull-right[ ## Cohort limitations ### We cannot distinguish between cohort effects and lifespan changes ### Cohort sizes should be roughly equal, and have roughly equal variance ] ??? So there are some limitations with cohorts. In fact, the power needed to find results is much higher in cohort studies as compared to longitudinal studies, as I will exemplify from a published study from out center later. --- class: dark, middle, center, clear ## "[...] even a perfect cross-sectional study is hopeless for the purpose of illuminating the causal structure of longitudinal change." <br> <div class="citation"> Raz, N. & Lindenberger, U. (2011) <br> Psychological bulletin, 137(5), 790–795. <br> <a href="https://psycnet.apa.org/doiLanding?doi=10.1037%2Fa0024503">doi:10.1037/a0024503</a> </div> ??? Salthouse (2011) critically reviewed cross-sectional and longitudinal relations among adult age, brain structure, and cognition (ABC) and identified problems in interpretation of the extant literature. His review, however, missed several important points. - First, individual differences among younger adults are not useful for understanding the aging of brain and behavior. - Mediation models of cross-sectional data represent age-related differences in target variables but fail to approximate time-dependent relations; thus, they do not elucidate the dimensions and dynamics of cognitive aging. --- # When cross-sectional design leads us astray ## Figure 3 _(modified)_ <img src="figures/nyberg_pnas_2010_fig3_transp.png" width="70%" style="display: block; margin: auto;" /> <div class="citation"> Nyberg et al (2010) PNAS <a href="https://doi.org/10.1073/pnas.1012651108">https://doi.org/10.1073/pnas.1012651108</a> </div> ??? Cross-sectional estimates of age-related changes in brain structure and function were compared with 6-y longitudinal estimates. The results indicated increased sensitivity of the longitudinal approach as well as qualitative differences. Critically, the cross-sectional analyses were suggestive of age-related frontal over recruitment, whereas the longitudinal analyses revealed frontal under recruitment with advancing age. The cross-sectional observation of over recruitment reflected a select elderly sample. However, when followed over time, this sample showed reduced frontal recruitment. These findings dispute inferences of true age changes on the basis of age differences, hence challenging some contemporary models of neurocognitive aging, and demonstrate age-related decline in frontal brain volume as well as functional response. --- class: center, dark # Lifespan research ## - longitudinal linear models - ??? For now, I want to zoom in a bit on the adulthood group. I choose this because a linear model is not a bad fit for this data. --- # Lifespan studies on humans - longitudinal - [LCBC studies](https://www.oslobrains.no/) - [Betula - Aging, memory, and dementia](https://www.umu.se/en/research/projects/betula---aging-memory-and-dementia/) - [The Rhineland study](https://www.neurodegenerationresearch.eu/it/cohort/the-rhineland-study/) ??? going back to the studies of lifespan human brain and cognition, to my knowledge, only three of these studies again are longitudinal or prospective. Rhineland, LCBC and Betula. --- # Longitudinal sampling .pull-left[ ## Tidy - Evenly spaced intervals - Little to zero attrition - Everyone follows the same protocol ] ??? Usually when we start sampling, we think of a tidy nice scheme that out participants will follow. These tidy schemes also make it possible to use models like repeated measures Anova, and manually calculated slopes in our models to understand change. -- .pull-right[ ## Chaos - Intervals nearly random - Attrition nearly random - Protocols nearly random ] ??? But often, reality does not meet expectation. And indeed, if your plan is to use mixed models, a fair bit of randomness in your sampling methods is actually preferable. --- # Mixed models in papers <img src="figures/meteyard_davies_2019_fig1_transp.png" width="60%" style="display: block; margin: auto;" /> <div class="citation"> Meteyard & Davies <i>PsyArXiV</i>, 2019, <a href='https://psyarxiv.com/h3duq/'>https://psyarxiv.com/h3duq/</a> </div> ??? The popularity of using mixed models is increasing. Here we see how the number of pubmed papers with linear mixed models increases yearly in psychological research, and this trend I'm pretty sure extends also to other fields. While mixed models as a concept is not new, the increasing power of computer and development of available tools is making it possible for more and more people to apply these methods to their data. So we will look more into using mixed models in lifespan research, and the benefits of that. --- # Mixed models <img src="figures/hierarchical_transp.png" width="60%" style="display: block; margin: auto;" /> <div class="citation"> <a href="https://slideplayer.com/slide/6049791/">source</a> </div> ??? Mixed models are not only suited for longitudinal studies, but actually any type of data where there is some structure or hierarchy in the data that might need to be accounted for. Multi-site data, are often treated in mixed models, where the sites are treated as we will treat people, in order to account for site-specific contributions to the observed data. --- # Lifespan research - longitudinal linear models 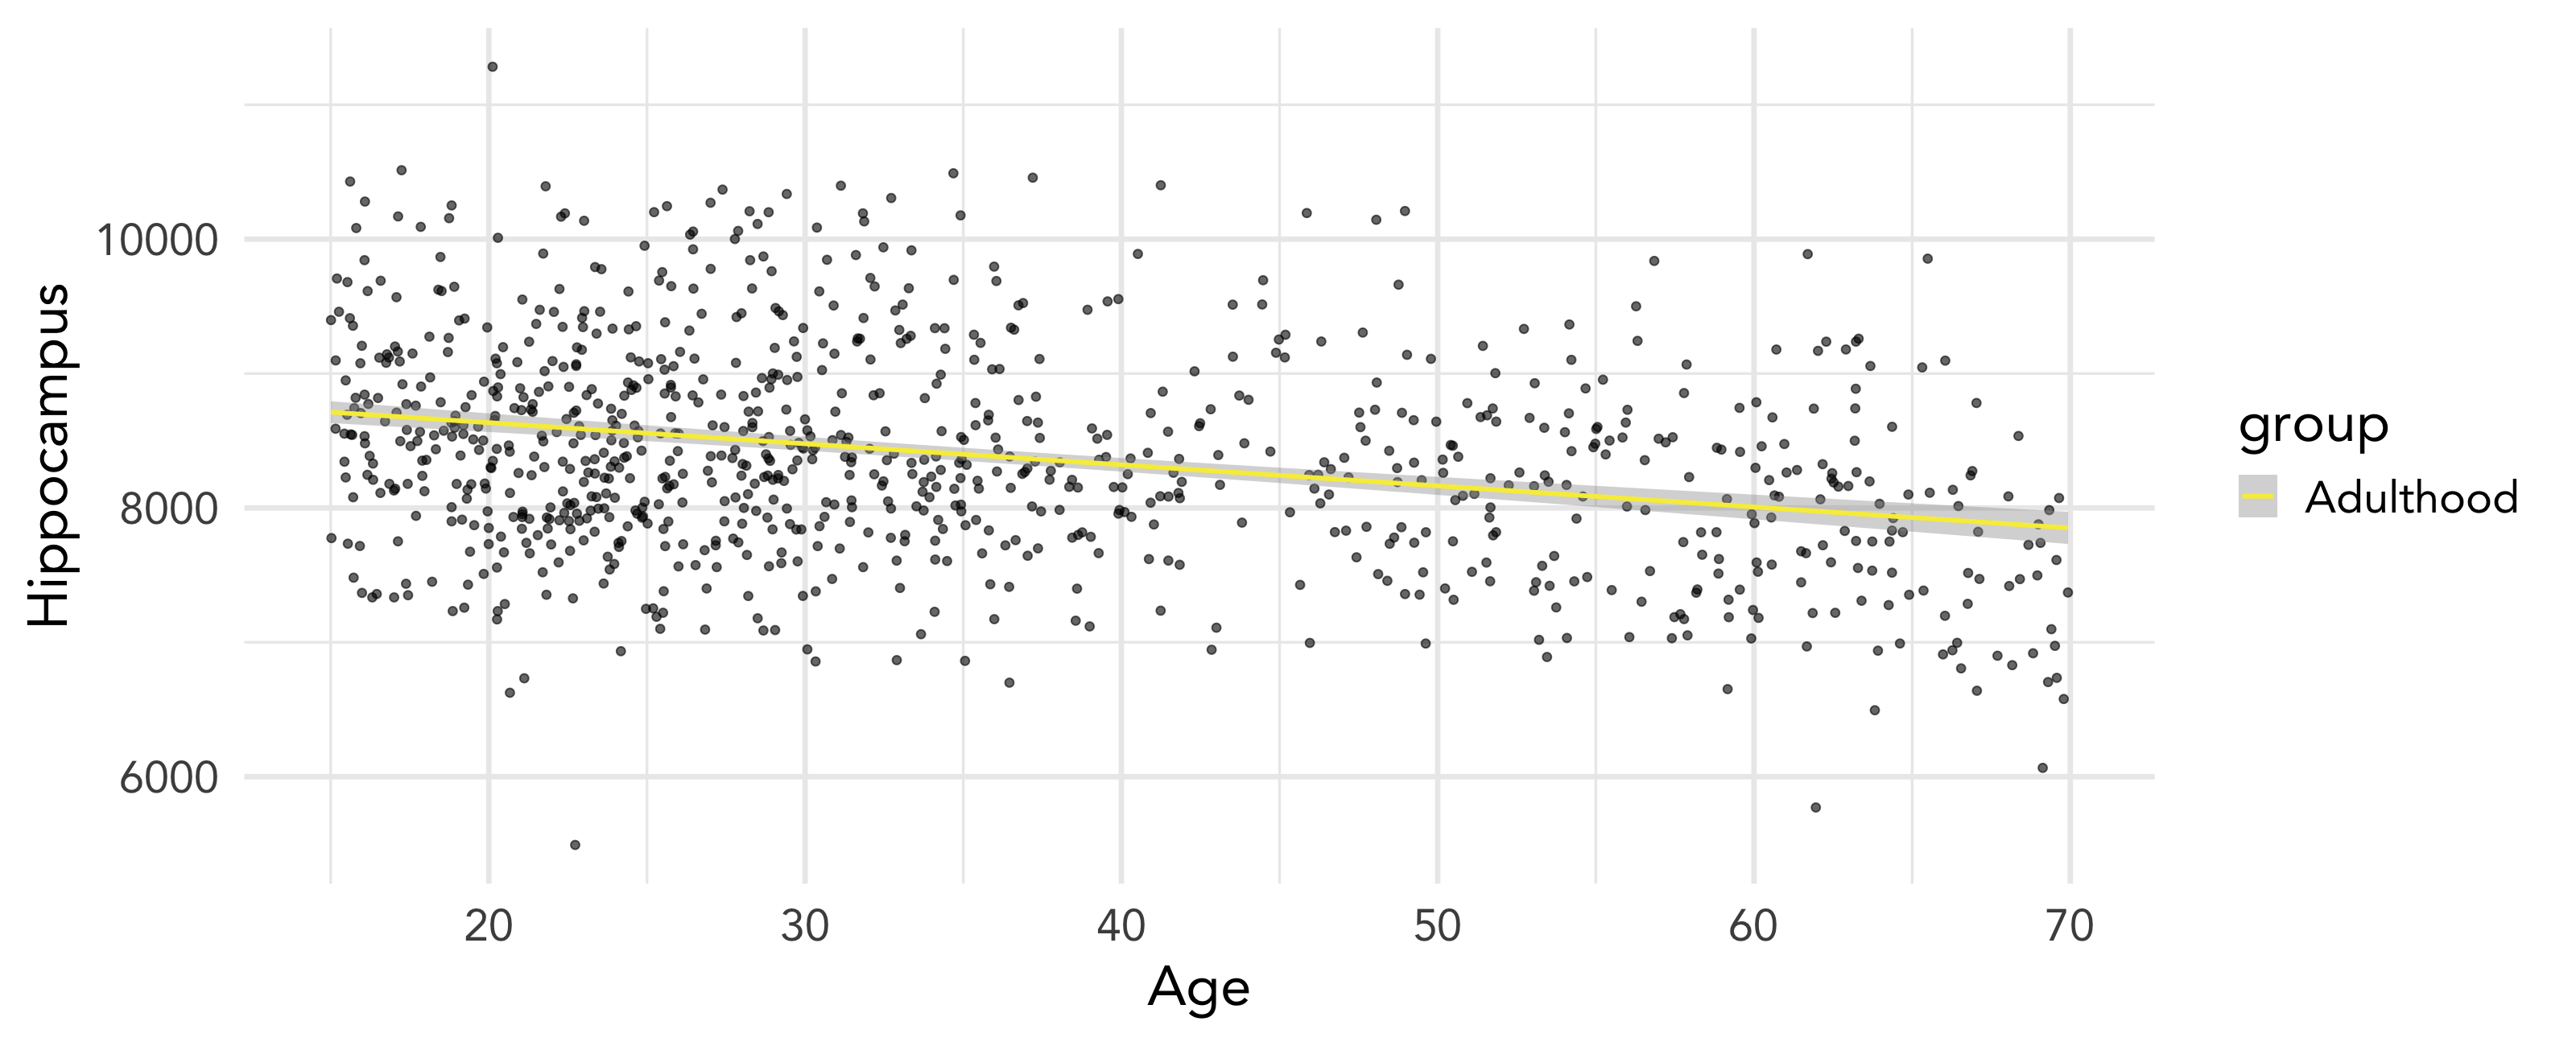<!-- --> ??? You can tell by the data that there is some curvature to the data, but its not so much that a linear model will go very wrong. But I was asked to come and talk about longitudinal data, not cohorts. So I've covered cohorts to show-case better what longitudinal studies bring to the table; the ability to actually say something about how people change, not only that there are differences between people of different ages. In this linear model, we are treating every data point as independent, as they are coming from different people. Which in many studies is true, but not for this data. --- # Lifespan research - longitudinal linear models <!-- --> ??? Here, I have connected the data points originating from the same person with lines. Notice how there are longitudinal participants across the entire lifespan, and that there is some order here. We have longitudinal data, people are sampled at different ages, with different time intervals, and varying observational time points. We are breaking all the rules for running simpler models like repeated measures anovas, who particularly depend on data being sampled uniformly. Longitudinal lifespan data usually does not have this tidy feature. People are difficult to sample, and controlling time intervals and people skipping measurement times becomes increasingly difficult the longer the study goes on. And you want the studies to keep on going as long as possible, and for each new observation from a participant, that participant becomes increasingly important to the study. --- # Lifespan research - longitudinal linear models <!-- --> ??? Here, we see the regression lines from two different models. One is the standard linear model, treating each observation as independent, and another having been informed that some of the observations actually are not independent. The change in the line is slight, and you might not think much of it. Indeed, the change is not huge here. In the practical talk, I will also cover briefly how you can check which model is best suited for your data, and how you can check if your models are violating base assumptions of the tests you are using. The main point here, is that you cannot use a normal linear model on repeated data, because it violates the key assumption of the observations being independent. Once you have multiple observations per person, you need to adopt an analysis strategy that accounts for this. Some may argue you could calculate the slope per person, and then use this in a model. Yes, you can, but you loose so much data! You loose all those who only have a single data point, and those with more than two, you need to decide which two to take, or the average change, and at which age? It forces you to really reduce the data a lot, when what you have is so rich, and ideal for other types of models, you should be utilizing those. --- class: dark, center # Lifespan research ## - longitudinal smoothing spline models - ??? We saw in the original plots, that there clearly was more to this relationship than a simple linear solution. When data is clearly non-linear, and you cannot improve fit with polynomials (quadratic, cubic etc.), then a smoothing spline is what you are after. Smoothing splines are very neat, and often by default find pretty good solutions. --- # Lifespan research - longitudinal smoothing spline <!-- --> ??? When looking at the entire data set, the model fit here is not really linear, it has a smooth shape. A curve that we should be accounting for in some way. This is quite common in lifespan research. Usually, there is a type of curve, and the curve is not cubic or quadratic or any type of polynomial. Those kinds of curves you can fit using a linear model, though that might sound counter intuitive. Polynomials are variations on the linear model, so it is not too difficult to alter the fit. But this data, is rather a complex type of smoothed spline. It alters its curve in a way that cannot be easily solved with variations of linear models, and requires other types of solutions. But as before, the normal generalized additive models require independent observations. This curve show us spline if the data were independent. We know they are not. --- # Lifespan research - longitudinal smoothing spline <!-- --> ??? So when we look at the prediction, the fit, of the model using the information about observations belonging together, the curve changes. The change might not seem large here, but it makes a difference, and the line parsimoniously also _looks_ like it fits the data better. We no longer have that weird tail going upwards, and there is less waves in the curve, and the curve at the end has a more smooth transition. The gam makes it look like a type of tipping point around age 60, when people have an accelerated decline, and in fact, a lot of research out there is showing just that. But here we can see, that when we incorporate longitudinal data aspects, that tipping point is not so tipping, its a more gradual change. And also, we can see that people are not ending up in the same place. People doing well at earlier ages have a similar change trajectory as those with lower scores, but there is an offset difference. --- class: title-slide, middle # Mixed models in lifespan research ## - literature examples - ??? It should now not come as a surprise to you that there are lots of benefits from doing mixed models when you have longitudinal or repeated measures data. --- # Mixed models in lifespan research - examples ??? **Objectives** Establish how the relationship between sleep and hippocampal volume loss unfolds across the adult lifespan. **Methods** Self-reported sleep measures and MRI-derived hippocampal volumes were obtained from 3105 cognitively normal participants (18–90 years). Hippocampal volume change was estimated from longitudinal MRIs, followed up to 11 years with a mean interval of 3.3 years. -- ### Figure 2 <img src="figures/fjell_sleep_2019_fig2_transp.png" width="65%" style="display: block; margin: auto;" /> <div class="citation"> Fjell et al. (2019) <i>Sleep</i>, <a href='https://doi.org/10.1093/sleep/zsz280'>https://doi.org/10.1093/sleep/zsz280</a> </div> ??? Relationships between age and hippocampal volume in Lifebrain. **Left panel:** GAMM was used to obtain the age-curve for hippocampal volume, using both cross-sectional and longitudinal information, co-varying for sex, ICV, and study (random effect). . **Right panel:** Spaghetti plot of hippocampal volume and volume change for all participants, color-coded by sample. **Results** No cross-sectional sleep—hippocampal volume relationships were found. --- # Mixed models in lifespan research - examples ### Figure 8 <img src="figures/fjell_sleep_2019_fig8_transp.png" width="60%" style="display: block; margin: auto;" /> <div class="citation"> Fjell et al. (2019) <i>Sleep</i>, <a href='https://doi.org/10.1093/sleep/zsz280'>https://doi.org/10.1093/sleep/zsz280</a> </div> ??? Annual percent change in volume as a function of sleep. Tested at four different ages, annual reduction in hippocampal volume was on average 0.22% greater in participants scoring two compared to zero on the PSQI items quality, efficiency, problems, and daytime tiredness. Error bars denote 95% CI. **Results** However, worse sleep quality, efficiency, problems, and daytime tiredness were related to greater hippocampal volume loss over time, with high scorers showing 0.22% greater annual loss than low scorers. The relationship between sleep and hippocampal atrophy did not vary across age. **Conclusions** Worse self-reported sleep is associated with higher rates of hippocampal volume decline across the adult lifespan. --- # Mixed models in lifespan research - examples ### Figure 9 <img src="figures/fjell_sleep_2019_fig9_transp.png" width="58%" style="display: block; margin: auto;" /> <div class="citation"> Fjell et al. (2019) <i>Sleep</i>, <a href='https://doi.org/10.1093/sleep/zsz280'>https://doi.org/10.1093/sleep/zsz280</a> </div> ??? Simulations showed that the observed longitudinal effects were too small to be detected as age-interactions in the cross-sectional analyses. Figure 9. Statistical power. The figure illustrates the superior power of the longitudinal design. The x-axis represents the size of PSQI × time (longitudinal) or PSQI × age interactions (cross-sectional). The dotted vertical line represents the observed effect size of the sleep efficiency × time interaction. As shown, the power to detect this is close to 1 (100%) with the longitudinal design, and very poor with the cross-sectional design. --- # Mixed models in lifespan research - examples ??? The human cerebral cortex is highly regionalized, and this feature emerges from morphometric gradients in the cerebral vesicles during embryonic development. We tested if this principle of regionalization could be traced from the embryonic development to the human life span. Data-driven fuzzy clustering was used to identify regions of coordinated longitudinal development of cortical surface area (SA) and thickness (CT) (n = 301, 4–12 years). -- ### Figure 1 _(modified)_ <img src="figures/fjell_cc_2019_fig1_mod_transp.png" width="85%" style="display: block; margin: auto;" /> <div class="citation"> Fjell et al. (2019) <i>Cerebral Cortex</i>, <a href='https://doi.org/10.1093/cercor/bhy266'>https://doi.org/10.1093/cercor/bhy266</a> </div> ??? each identified developmental SA and CT clusters showed distinguishable life span trajectories in a larger longitudinal data set (4–88 years, 1633 observations), and the SA and CT clusters showed differential relationships to cognitive functions. Surface area. **Left panel:** Clusters of coordinated surface area (SA) in development, 2- (top), 3- (middle), and 4-cluster (bottom) solutions. **Right panel:** The life span trajectories of each cluster from the 3-cluster solution. **Top:** Trajectories residualized on age (x-axis). **Bottom:** The residual age relationship (y-axis) for each cluster accounting for the other 2 clusters. These curves show the relationship between each cluster and age, if the common variance shared with the other clusters are accounted for. Relative to the other clusters, the anterior cluster shows a slight increase with age (larger cluster area goes with older age), while the limbic cluster shows a linear decline (larger cluster area goes with younger age). --- # Mixed models in lifespan research - examples ### Figure 2 _(modified)_ <img src="figures/fjell_cc_2019_fig2_mod_transp.png" width="85%" style="display: block; margin: auto;" /> <div class="citation"> Fjell et al. (2019) <i>Cerebral Cortex</i>, <a href='https://doi.org/10.1093/cercor/bhy266'>https://doi.org/10.1093/cercor/bhy266</a> </div> ??? Cortical thickness. **Left panel:** Clusters of coordinated cortical thickness in development, 2- (top), 3- (middle), and 4-cluster (bottom) solutions. **Right panel:** The life span trajectories of each cluster from the 3-cluster solution. **Top:** Trajectories residualized on age (x-axis). **Bottom:** The residual age relationship (y-axis) for each cluster accounting for the other 2 clusters This means that regions that developed together in childhood also changed together throughout life, demonstrating continuity in regionalization of cortical changes. The AP divide in SA development also characterized genetic patterning obtained in an adult twin sample. In conclusion, the development of cortical regionalization is a continuous process from the embryonic stage throughout life. --- # Mixed models in lifespan research - examples ??? Changes in cortical thickness occur throughout the lifespan, but the neurobiological substrates are poorly understood. Here, we compared the regional patterns of cortical thinning (>4000 observations) with those of gene expression for several neuronal and non-neuronal cell types (Allen Human Brain Atlas). Inter-regional profiles of less thinning and greater gene expression several marker genes during development. The same expression – thinning patterns – were mirrored in aging, but in the opposite direction. -- ### Figure 1 <img src="figures/vidal-pineiro_2019_transp.png" width="67%" style="display: block; margin: auto;" /> <div class="citation"> Vidal-Piñeiro et al. (2019) <i>bioRxiv</i>, doi: <a href='https://doi.org/10.1101/585786'>https://doi.org/10.1101/585786</a> </div> ??? Trajectories of average cortical thickness. The upper and lower plots exhibit the trajectories of cortical thickness and cortical thinning during the lifespan, respectively. Cortical thickness fitting (black line) overlies a spaghetti plot that displays each observation (dots), participant (thin lines) and, scanner (color). The y-axis units represent mm and mm/year for the thickness and thinning plots, respectively. The dotted red line in the cortical thinning graph represents 0 change, negative and positive values represent thinning and thickening, respectively. --- # Mixed models in lifespan research - examples .pull-left[ ### Figure 2 <img src="figures/fjell_dcn_2019_fig2_transp.png" width="68%" style="display: block; margin: auto;" /> ] ??? The aim of the present study was to test whether there are unique developmental changes in recall memory performance using extended retention intervals, and whether these are related to structural maturation of sub-regions of the hippocampus. 650 children and adolescents from 4.1 to 24.8 years were assessed in total 962 times (mean interval ≈ 1.8 years). The California Verbal Learning Test (CVLT) and the Rey Complex Figure Test (CFT) were used. Recall was tested 30 min and ca. 10 days after encoding. **Fig. 2.** Developmental trajectories for memory. Development of CVLT (left column) and CFT (right column) recall performance. The plots in the bottom row show how performance in the 10 days retention interval recall condition improves when recall performance on the 30 min retention interval condition is accounted for. -- .pull-right[ ### Figure 3 <img src="figures/fjell_dcn_2019_fig3_transp.png" width="68%" style="display: block; margin: auto;" /> ] <div style="text-align: right; font-size: 12pt;"> Fjell et al. (2019) <i>Developmental Cognitive Neuroscience</i>, <a href='https://doi.org/10.1016/j.dcn.2019.100723'>https://doi.org/10.1016/j.dcn.2019.100723</a> </div> ??? **Fig. 3.** Developmental trajectories for hippocampus. Structural maturation of hippocampal sub-regions. Top row shows microstructure (mean diffusion), bottom row shows volume. We found unique developmental effects on recall in the extended retention interval condition independently of 30 min recall performance. For CVLT, major improvements happened between 10 and 15 years. --- # Mixed models in lifespan research - examples .pull-left[ ### Figure 4 <img src="figures/fjell_dcn_2019_fig4_transp.png" width="68%" style="display: block; margin: auto;" /> ] .pull-right[ ### Figure 5 _(modified)_ <img src="figures/fjell_dcn_2019_fig5_mod_transp.png" width="78%" style="display: block; margin: auto;" /> ] <div style="text-align: right; font-size: 12pt;"> Fjell et al. (2019) <i>Developmental Cognitive Neuroscience</i>, <a href='https://doi.org/10.1016/j.dcn.2019.100723'>https://doi.org/10.1016/j.dcn.2019.100723</a> </div> ??? **Memory and hippocampal subfields** The heat plot illustrates the statistical significance (uncorrected p-value) of the relationship between hippocampal structure (volume and mean diffusion) and memory performance. The relationships did not show anterior-posterior hippocampal axis differences. In conclusion, performance on recall tests using extended retention intervals shows unique development, likely due to changes in encoding depth or efficacy, or improvements of long-term consolidation processes. --- # Mixed models in lifespan research - examples ### Figure 2 <img src="figures/ferschmann_fig2_transp.png" width="50%" style="display: block; margin: auto;" /> <div class="citation"> Freschmann et al. <i>Developmental Cognitive Neuroscience</i>, Volume 40, December 2019, <a href='https://doi.org/10.1016/j.dcn.2019.100734'>https://doi.org/10.1016/j.dcn.2019.100734</a> </div> ??? Prosocial behavior, or voluntary actions that intentionally benefit others, relate to desirable developmental outcomes such as peer acceptance, while lack of prosocial behavior has been associated with several neurodevelopmental disorders. Mapping the biological foundations of prosociality may thus aid our understanding of both normal and abnormal development, yet how prosociality relates to cortical development is largely unknown. Here, relations between prosociality, as measured by the Strengths and Difficulties Questionnaire (self-report), and changes in thickness across the cortical mantle were examined using mixed-effects models. The sample consisted of 169 healthy individuals (92 females) aged 12–26 with repeated MRI from up to 3 time points, at approximately 3-year intervals (301 scans). - Prosociality relates to cortical development from early adolescence to adulthood --- # Mixed models in lifespan research - examples ### Figure 3 <img src="figures/ferschmann_fig3_transp.png" width="70%" style="display: block; margin: auto;" /> <div class="citation"> Freschmann et al. <i>Developmental Cognitive Neuroscience</i>, Volume 40, December 2019, <a href='https://doi.org/10.1016/j.dcn.2019.100734'>https://doi.org/10.1016/j.dcn.2019.100734</a> </div> ??? - Higher prosociality relates to greater cortical thinning in early adolescence - This is followed by attenuation of this pattern during the transition to adulthood Fig. 3. Cortical maturation for individuals with high and low prosociality. Individuals were classified as high prosocial if they consistently rated themselves as high on prosociality throughout the study, and as low prosocial if they consistently rated themselves as low. The plot shows mean cortical thickness from the clusters where interactions between prosociality and age2 were significant. Note that the low/high division was made for illustration purposes only, while the statistical analyses were run with prosocial behavior as a continuous measure. --- # Mixed models in lifespan research - examples ### Figure 3 <img src="figures/ferschmann_fig4_transp.png" width="80%" style="display: block; margin: auto;" /> <div class="citation"> Freschmann et al. <i>Developmental Cognitive Neuroscience</i>, Volume 40, December 2019, <a href='https://doi.org/10.1016/j.dcn.2019.100734'>https://doi.org/10.1016/j.dcn.2019.100734</a> </div> ??? Fig. 4. Contour plots of relations between prosocial behavior, age and cortical thickness. The plots indicate that the relations between prosociality and CT were positive for the youngest and the oldest group across all the identified significant clusters. Such a relationship was not present in the middle of the age range (late adolescence). Each plot contains mean cortical thickness from the clusters where interactions between prosociality and age2 were significant. The green to white color scale indicates low to high cortical thickness values. - Associations are observed in regions involved in social cognition and behavioral control --- class: dark, center # Lifespan research - Summary .pull-left[ ## Cohort studies ### Can reveal variability between people and ages ### Can cover the lifespan with enough samples ### Can reveal plausible trajectories ### Easier to sample, requires large sample size ] -- .pull-right[ ## Longitudinal studies ### Can reveal real changes **over time** ### Can reveal variations in offset **and** slopes ### Harder to sample, requires smaller sample size ### Problems with possible attrition bias ]