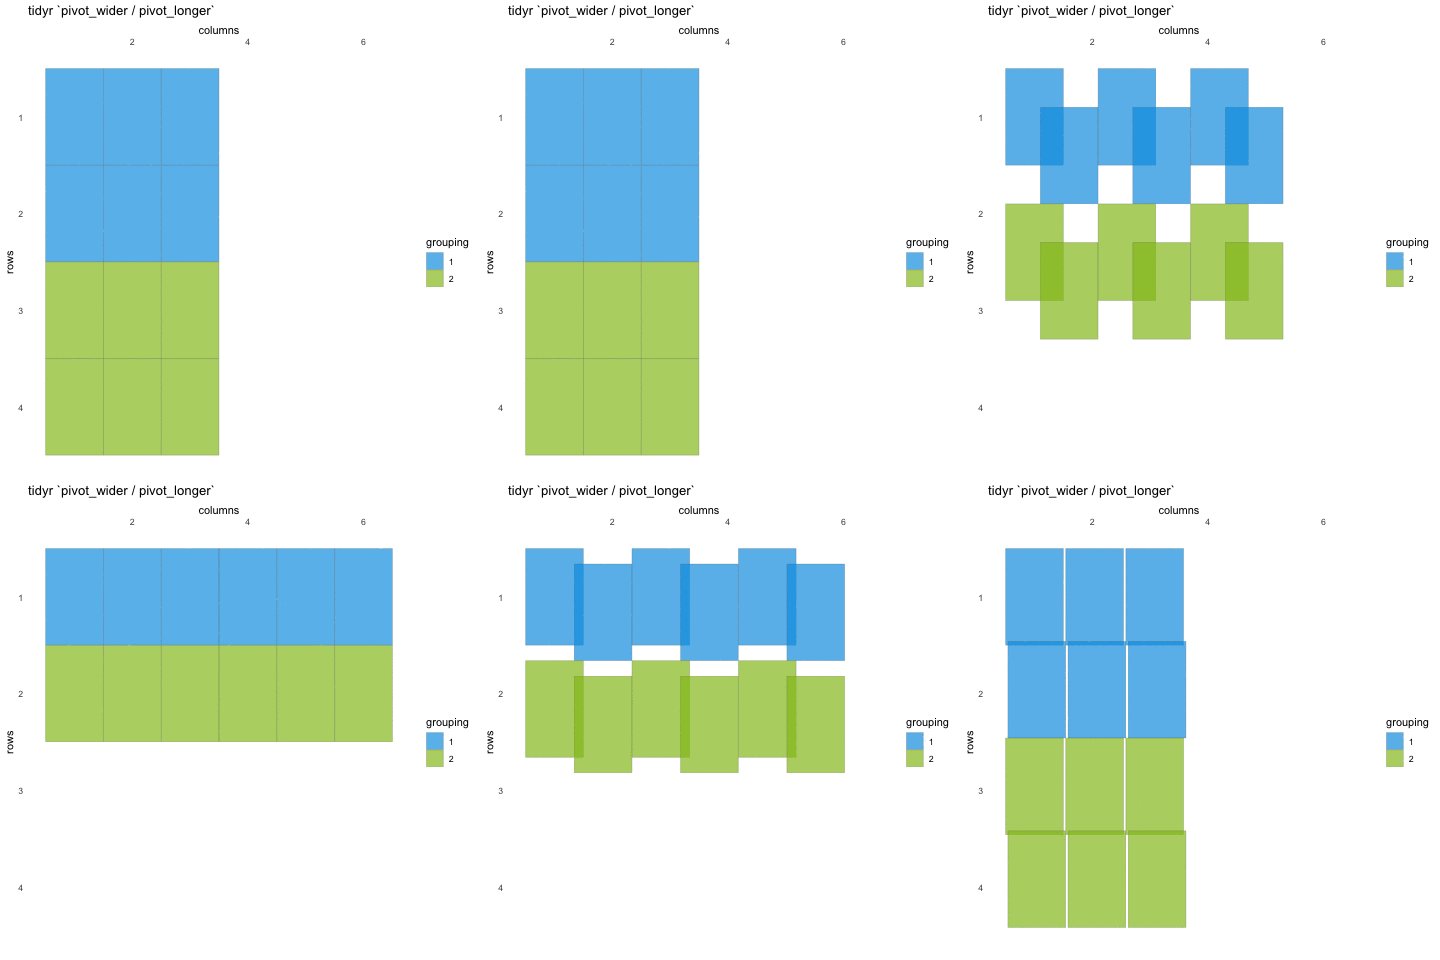
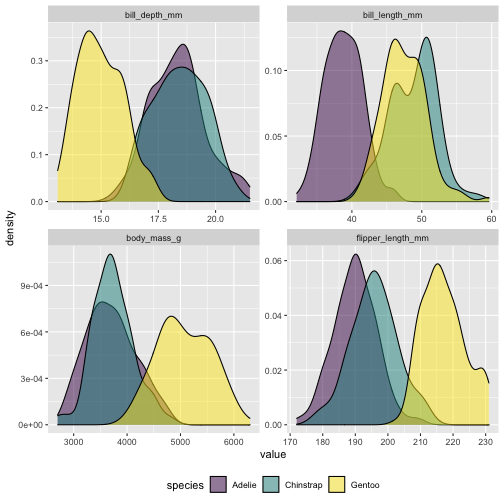
class: middle, right, title-slide .title[ # Tidy data reshaping & summaries ] .author[ ### Athanasia Monika Mowinckel ] --- layout: true <div class="my-sidebar"></div> --- class: dark, center background-image: url(img/tidyr.png), url(img/dplyr.png), url(img/purrr.png) background-size: 15% background-position: 32% 65%, 50% 65%, 68% 65% # Part 2 ## Tidy data reshaping & summaries --- class: middle, inverse ## Tidy data reshaping & summaries <ul style="color: white;"> - pivoting data with [tidyr](https://tidyr.tidyverse.org/) (~25 min) - grouped summaries with [dplyr](https://dplyr.tidyverse.org/) (~25 min) - working with nested data using [purrr](https://purrr.tidyverse.org/) (~25 min) --- class: dark, center background-image: url(img/tidyr.png) background-size: 15% background-position: 50% 65% # tidyr ## pivoting / altering data shape --- background-image: url(img/tidyr.png) background-size: 8% background-position: 95% 5% ## tidyr The goal of tidyr is to help you create tidy data. Tidy data is data where: - Every column is variable. - Every row is an observation. - Every cell is a single value. Tidy data describes a standard way of storing data that is used wherever possible throughout the tidyverse. If you ensure that your data is tidy, you’ll spend less time fighting with the tools and more time working on your analysis. Learn more about tidy data in `vignette("tidy-data")`. --- background-image: url(img/tidyr.png) background-size: 8% background-position: 95% 5% ### Tall/long vs. wide data - Tall (or long) data are considered "tidy", in that they adhere to the three tidy-data principles - Wide data are not necessarily "messy", but have a shape less ideal for easy handling in the tidyverse Example in longitudinal data design: - wide data: each participant has a single row of data, with all longitudinal observations in separate columns - tall data: a participant has as many rows as longitudinal time points, with measures in separate columns --- background-image: url(img/tidyr.png) background-size: 8% background-position: 95% 5% ## tidyr .pull-left[ #### pivoting `pivot_longer()` - wide to long `pivot_wider()` - long to wide Transforms data shape ] -- .pull-right[ <!-- --> ] --- background-image: url(img/tidyr.png) background-size: 8% background-position: 95% 5% ## Pivoting longer takes tidy-select column arguments, so it is easy to grab all the columns you are after. ```r penguins |> pivot_longer(contains("_")) ``` ``` ## # A tibble: 1,376 × 6 ## species island sex year name value ## <fct> <fct> <fct> <int> <chr> <dbl> ## 1 Adelie Torgersen male 2007 bill_l… 39.1 ## 2 Adelie Torgersen male 2007 bill_d… 18.7 ## 3 Adelie Torgersen male 2007 flippe… 181 ## 4 Adelie Torgersen male 2007 body_m… 3750 ## 5 Adelie Torgersen female 2007 bill_l… 39.5 ## 6 Adelie Torgersen female 2007 bill_d… 17.4 ## 7 Adelie Torgersen female 2007 flippe… 186 ## 8 Adelie Torgersen female 2007 body_m… 3800 ## 9 Adelie Torgersen female 2007 bill_l… 40.3 ## 10 Adelie Torgersen female 2007 bill_d… 18 ## # … with 1,366 more rows ``` --- background-image: url(img/tidyr.png) background-size: 8% background-position: 95% 5% ## Why pivot longer? .pull-left[ Can be convenient for easy sub-plots with ggplot ```r penguins |> pivot_longer(contains("_")) |> ggplot(aes(x = value, fill = species)) + geom_density() + facet_wrap(~ name, scales = "free") + scale_fill_viridis_d(alpha = .5) + theme(legend.position = "bottom") ``` ] .pull-right[ <!-- --> ] --- background-image: url(img/tidyr.png) background-size: 8% background-position: 95% 5% ### pivoting wider ```r penguins_long <- penguins |> mutate(id = row_number()) |> pivot_longer(contains("_"), names_to = c("body_part", "measure", "unit"), names_sep = "_") penguins_long |> pivot_wider(names_from = c("body_part", "measure", "unit"), # pivot these columns values_from = "value", # take the values from here names_sep = "_") # separate names_from with this character ``` ``` ## # A tibble: 344 × 9 ## species island sex year id bill_l…¹ ## <fct> <fct> <fct> <int> <int> <dbl> ## 1 Adelie Torgersen male 2007 1 39.1 ## 2 Adelie Torgersen female 2007 2 39.5 ## 3 Adelie Torgersen female 2007 3 40.3 ## 4 Adelie Torgersen <NA> 2007 4 NA ## 5 Adelie Torgersen female 2007 5 36.7 ## 6 Adelie Torgersen male 2007 6 39.3 ## 7 Adelie Torgersen female 2007 7 38.9 ## 8 Adelie Torgersen male 2007 8 39.2 ## 9 Adelie Torgersen <NA> 2007 9 34.1 ## 10 Adelie Torgersen <NA> 2007 10 42 ## # … with 334 more rows, 3 more variables: ## # bill_depth_mm <dbl>, ## # flipper_length_mm <dbl>, body_mass_g <dbl>, ## # and abbreviated variable name ## # ¹bill_length_mm ``` --- class: inverse, middle, center ## Go to RStudio ### live demo --- class: inverse, middle, center ## Go to subsetting exercises ### `learnr::run_tutorial("005-pivoting", "tidyquintro")` <div class="countdown" id="timer_99589a47" data-warn-when="30" data-update-every="1" data-play-sound="true" tabindex="0" style="top:50%;right:0;left:0;margin:10%;padding:50px;font-size:4em;"> <div class="countdown-controls"><button class="countdown-bump-down">−</button><button class="countdown-bump-up">+</button></div> <code class="countdown-time"><span class="countdown-digits minutes">08</span><span class="countdown-digits colon">:</span><span class="countdown-digits seconds">00</span></code> </div> --- class: dark, center background-image: url(img/dplyr.png), url(img/tidyr.png) background-size: 15% background-position: 41% 65%, 59% 65% ## dplyr + tidyr ### data summaries --- background-image: url(img/dplyr.png) background-size: 8% background-position: 95% 5% ## dplyr - comparison to base-R #### tidy ```r penguins |> summarise(mean(bill_length_mm, na.rm = TRUE)) ``` #### base ```r mean(penguins$bill_length_mm, na.rm = TRUE) ``` <div style="font-size: 15px;"> <a href="https://dplyr.tidyverse.org/articles/base.html">https://dplyr.tidyverse.org/articles/base.html</a> </div> --- class: inverse, middle, center ## Go to RStudio ### live demo --- class: inverse, middle, center ## Go to subsetting exercises ### `learnr::run_tutorial("006-summarising", "tidyquintro")` <div class="countdown" id="timer_94c17a1c" data-warn-when="30" data-update-every="1" data-play-sound="true" tabindex="0" style="top:50%;right:0;left:0;"> <div class="countdown-controls"><button class="countdown-bump-down">−</button><button class="countdown-bump-up">+</button></div> <code class="countdown-time"><span class="countdown-digits minutes">08</span><span class="countdown-digits colon">:</span><span class="countdown-digits seconds">00</span></code> </div> --- class: dark, center background-image: url(img/dplyr.png), url(img/tidyr.png), url(img/purrr.png) background-size: 15% background-position: 32% 65%, 50% 65%, 68% 65% # dplyr + tidyr + purrr ## Working with nested data - avoiding loops --- background-image: url(img/dplyr.png), url(img/tidyr.png), url(img/purrr.png) background-size: 8% background-position: 93% 5%, 97.5% 19%, 84.5% 5% ## comparison to base-R #### tidy ```r penguins |> nest_by(species, island) |> mutate(lm_model = list( lm(bill_length_mm ~ bill_depth_mm, data = data) )) ``` #### base ```r penguins$groups <- interaction(penguins$species, penguins$island) models <- list() for(i in 1:length(unique(penguins$groups))){ tmp <- penguins[penguins$groups == groups[i],] models[[i]] <- lm(bill_length_mm ~ bill_depth_mm, data = data) } # or lapply(unique(penguins$groups), function(x) lm(bill_length_mm ~ bill_depth_mm, data = penguins[penguins$groups == x,])) ``` <div style="font-size: 15px;"> <a href="https://dplyr.tidyverse.org/articles/base.html">https://dplyr.tidyverse.org/articles/base.html</a> </div> --- class: inverse, middle, center ## Go to RStudio ### live demo --- class: inverse, middle, center ## Go to subsetting exercises ### `learnr::run_tutorial("006-nesting", "tidyquintro")` <div class="countdown" id="timer_516ffe99" data-warn-when="30" data-update-every="1" data-play-sound="true" tabindex="0" style="top:50%;right:0;left:0;"> <div class="countdown-controls"><button class="countdown-bump-down">−</button><button class="countdown-bump-up">+</button></div> <code class="countdown-time"><span class="countdown-digits minutes">08</span><span class="countdown-digits colon">:</span><span class="countdown-digits seconds">00</span></code> </div> --- class: dark, middle, center # End of part 2