Neon Ghosts with ggplot2
Make your own glowing, wiggly ghosts in R with a dash of randomness and a lot of neon.
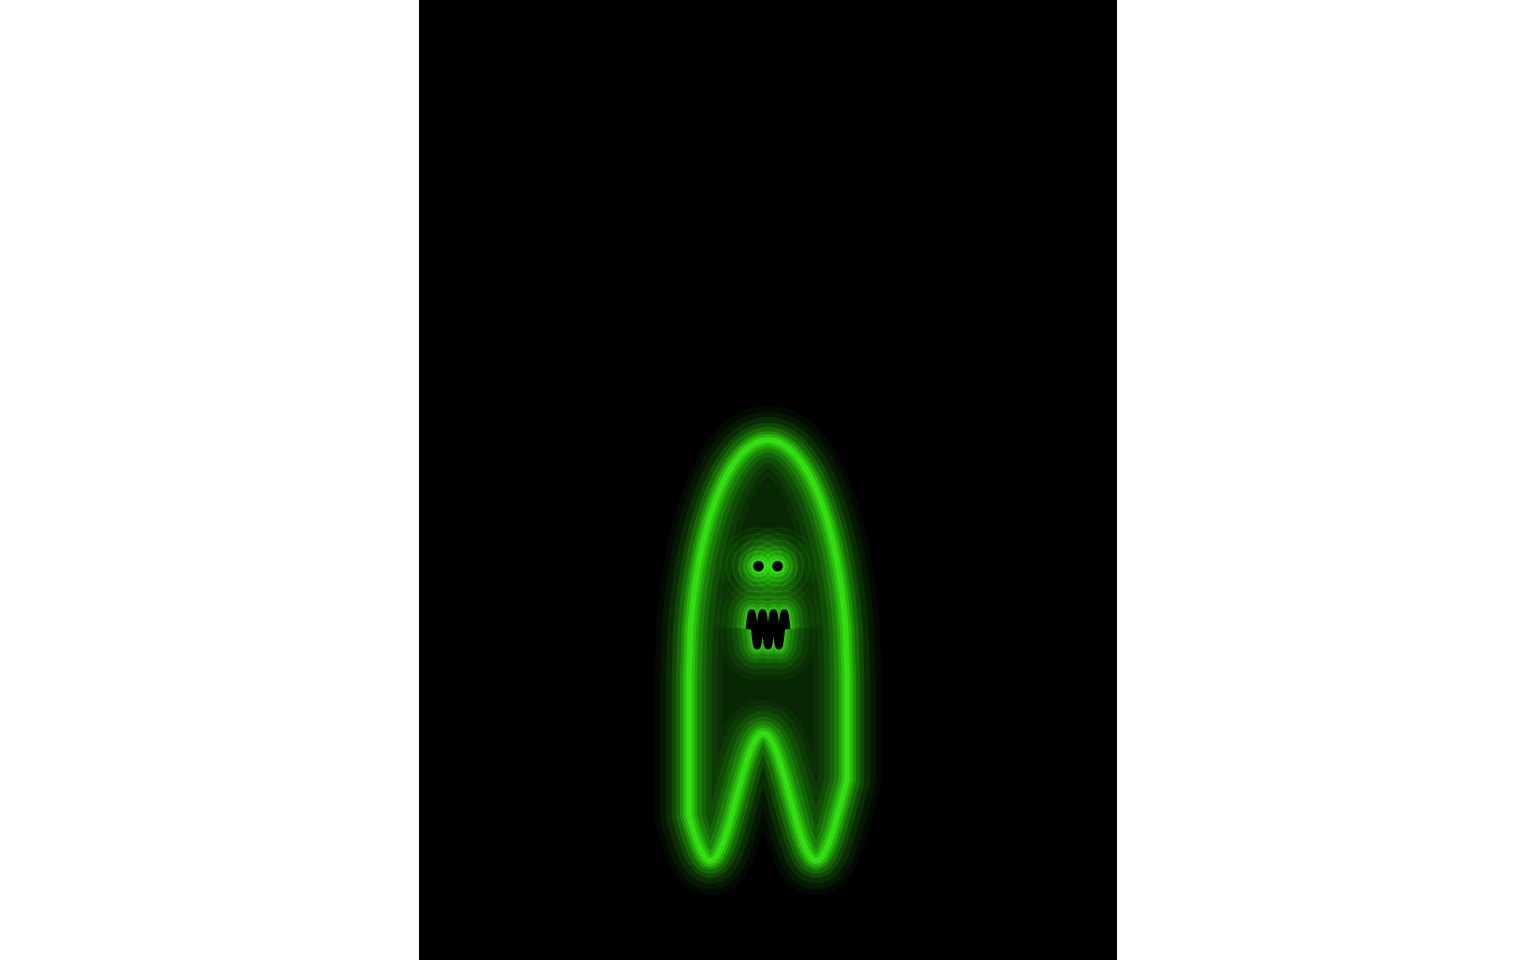
Ever wanted to make a haunted house in R? Here’s a quick and fun way to conjure up a whole gang of neon ghosts using ggplot2. Each ghost is a little different — some tall, some stout, all a bit wobbly—thanks to a shape generator that randomizes their size and wiggle.
The plotting function layers up neon glows for the outline, eyes, and mouth, then adds a faint fill and solid black features for that classic ghostly look. Try running it a few times to see what kind of spectral friends you get!
library(ggplot2)
library(scales)

#' Ghost plotting function
#' @param ghost_df Data frame with x and y coordinates of the ghost shape
#' @param ghost_color Color of the ghost (default is neon green)
#' @return ggplot object of the ghost
plot_simple_ghost <- function(ghost_df, ghost_color = "#39FF14") {
  x_center <- mean(range(ghost_df$x))
  y_top <- max(ghost_df$y)
  y_bottom <- min(ghost_df$y)
  ghost_height <- y_top - y_bottom
  ghost_width <- diff(range(ghost_df$x))

  # Eyes
  eye_y <- y_bottom + 0.7 * ghost_height
  eye_x <- x_center + c(-0.06, 0.06) * ghost_width
  eyes <- data.frame(x = eye_x, y = rep(eye_y, 2))

  # Mouth: several waves
  mouth_width <- ghost_width * 0.4
  mouth_x <- seq(x_center - 0.3 * mouth_width, x_center + 0.3 * mouth_width, length.out = 80)
  mouth_y <- y_bottom + 0.55 * ghost_height + sin(seq(0, 7 * pi, length.out = 80)) * 0.04 * ghost_height
  mouth <- data.frame(x = mouth_x, y = mouth_y)

  # 8 neon glow layers
  glow_layers <- data.frame(
    linewidth = c(12, 10, 8, 6, 4.5, 3, 2, 1),
    alpha = c(0.04, 0.06, 0.09, 0.13, 0.18, 0.25, 0.35, 0.5)
  )

  p <- ggplot() +
    geom_polygon(
      data = ghost_df, aes(x, y),
      fill = ghost_color, alpha = 0.15, color = NA
    )

  # Glow layers for outline, eyes, and mouth
  for(i in seq_len(nrow(glow_layers))) {
    p <- p +
      geom_polygon(
        data = ghost_df, aes(x, y),
        fill = NA, color = scales::alpha(ghost_color, glow_layers$alpha[i]),
        linewidth = glow_layers$linewidth[i]
      ) +
      geom_point(
        data = eyes, aes(x, y),
        color = scales::alpha(ghost_color, glow_layers$alpha[i]),
        size = glow_layers$linewidth[i] * 1.1
      ) +
      geom_path(
        data = mouth, aes(x, y),
        color = scales::alpha(ghost_color, glow_layers$alpha[i]),
        linewidth = glow_layers$linewidth[i]
      )
  }

  # Solid black mouth and eyes
  p <- p +
    geom_path(
      data = mouth, aes(x, y),
      color = "black", linewidth = 1.2
    ) +
    geom_point(
       data = eyes, aes(x, y),
       color = "black",
       size = 1.2
    )

  # Fix aspect ratio and theme
  p +
   coord_fixed(
       xlim = c(-4, 4),
       ylim = c(-3, 8),
       expand = TRUE
   ) +
   theme_void() +
   theme(
      plot.background = element_rect(fill = "black", color = NA),
      panel.background = element_rect(fill = "black", color = NA)
    )
}

#' Generate a random ghost shape
#' @param seed Optional seed for reproducibility
#' @return Data frame with x and y coordinates of the ghost shape
ghost_shape <- function(seed = NULL) {
  if (!is.null(seed)) set.seed(seed)
  width <- sample(seq(0.5, 3, length.out = 6), 1)
  height <- sample(1:6,1)
  x <- seq(-1, 1, length.out = 100) * width
  amp <- runif(1, 0.15, 0.28)
  freq <- sample(3:7, 1)
  phase <- runif(1, 0, 2*pi)
  y_top <- sqrt(1 - (x/width)^2) * height + runif(1, -0.03, 0.03)
  y_bottom <- -0.5 * height + sin(seq(0, freq * pi, length.out = 100) + phase) * amp * height
  data.frame(
    x = c(x, rev(x)),
    y = c(y_top, rev(y_bottom))
  )
}

ghost_shape() |>
       plot_simple_ghost(ghost_color = "#39FF14")

ghost_shape() |>
       plot_simple_ghost(ghost_color = "#FF6EC7")

ghost_shape() |>
       plot_simple_ghost(ghost_color = "#1E90FF")

For attribution, please cite this work as
Dr. Mowinckel
(Oct 31, 2025)
Neon Ghosts with ggplot2.
Retrieved from https://drmowinckels.io/blog/2025/neon-ghosts/.
DOI: https://www.doi.org/10.5281/zenodo.17496544
BibTeX citation
@misc{
2025-neon-ghosts-with-ggplot2,
author = "Dr. Mowinckel",
title = "Neon Ghosts with ggplot2",
url = "https://drmowinckels.io/blog/2025/neon-ghosts/",
year = 2025,
doi = "https://www.doi.org/10.5281/zenodo.17496544",
updated = "Mar 2, 2026"
}
2025-neon-ghosts-with-ggplot2,
author = "Dr. Mowinckel",
title = "Neon Ghosts with ggplot2",
url = "https://drmowinckels.io/blog/2025/neon-ghosts/",
year = 2025,
doi = "https://www.doi.org/10.5281/zenodo.17496544",
updated = "Mar 2, 2026"
}